

Carbon Footprint Accounting Report
Release time:
2024-06-18 11:33
Product Carbon Footprint Accounting Information Sheet
| Accounting Entrusting Party |
Shandong Huacheng Sino-German Transmission Equipment Co., Ltd. |
Address |
No. 126, Zhangbo Road, Boshan Economic Development Zone, Zibo City, Shandong Province |
|||
| Contact Person |
Zhao Jing |
Contact Information |
18353369887 |
|||
| Product Manufacturer |
Shandong Huacheng Sino-German Transmission Equipment Co., Ltd. |
Address |
No. 126, Zhangbo Road, Boshan Economic Development Zone, Zibo City, Shandong Province |
|||
| Product Production Enterprise |
Shandong Huacheng Sino-German Transmission Equipment Co., Ltd. |
Address |
No. 126, Zhangbo Road, Boshan Economic Development Zone, Zibo City, Shandong Province |
|||
| Product Brand Owner |
Shandong Huacheng Sino-German Transmission Equipment Co., Ltd. |
|||||
| Product Name |
Reducer |
|||||
| Product Series/Specification/Model |
ML3PSF120 |
|||||
| Accounting Basis |
ISO 14067:2018 "Requirements and Guidelines for Quantification of Greenhouse Gas Product Carbon Footprint" |
|||||
| Life Cycle Boundary |
From Cradle to Gate |
|||||
| Product Carbon Footprint Functional Unit |
One ML3PSF120 Reducer |
|||||
| Carbon Footprint (CO2-eq) |
4371.68kg |
|||||
| Prepared by |
Zhao Jing |
Signature |
|
Date |
March 12, 2024 |
|
1. Life Cycle Assessment and Product Carbon Footprint
Life Cycle Assessment (LCA) is a standardized, quantitative method for evaluating the resource and environmental efficiency throughout a product's life cycle. By tracing the upstream and downstream production and consumption processes of a product, it helps producers identify stages where environmental issues arise and further avoid shifting impacts between different life cycle stages and environmental impact categories. Many industries domestically and internationally have conducted product LCA evaluations for benchmarking and improvement within the industry, external communication, and as a reference for industry policy formulation.
Product carbon footprint refers to the total direct and indirect greenhouse gas emissions released during a product's life cycle, including multiple stages such as raw material extraction, product manufacturing (or service provision), packaging, distribution, use, and final recycling or disposal. The product carbon footprint has become an effective quantitative indicator used to measure corporate performance, management level, and the product's impact on climate change.
2. Goal and Scope Definition
2.1 Accounting Purpose
Life cycle assessment and carbon footprint accounting, as the foundation for eco-design and green manufacturing implementation, have become research and focus hotspots in recent years. Conducting life cycle assessment and carbon footprint accounting can maximize resource savings and greenhouse gas emission reductions. This is valuable and meaningful for green industry development, industrial upgrading and transformation, and addressing potential export trade barriers.
This project follows the requirements of ISO14040:2006 "Environmental Management - Life Cycle Assessment Principles and Framework", ISO 14044:2006 "Environmental Management - Life Cycle Assessment Requirements and Guidelines", and ISO 14067:2018 "Requirements and Guidelines for Quantification of Greenhouse Gas Product Carbon Footprint" to establish a cradle-to-gate life cycle model for XX, prepare a carbon footprint accounting report, and the results and related analysis can be used for the following purposes:
Obtain the product's life cycle carbon footprint indicator results to help the company compare carbon emissions under different processes and select more environmentally friendly process technologies.
The report can be used by downstream customers or end consumers to choose lower-carbon products based on the product's life cycle carbon footprint indicators.
The report can be used for marketing to demonstrate the company's advantages in addressing climate change and greenhouse gas emission management.
2.2 Accounting Scope
2.2.1 Functional Unit
The functional unit of this study is defined as: ML3PSF120 reducer, with basic product information shown in Table 1-1.
Table 1-1 Product Details Table
| Basic Information |
Content |
| Net Weight per Unit Product |
6400kg |
| Gross Weight per Unit Product |
6700kg |
| Production Volume During Data Collection Period |
4 units |
2.2.2 Accounting Indicators
This project calculates carbon footprint indicators to help companies identify ways to reduce product greenhouse gas emissions and achieve energy saving and emission reduction, providing a basis for evaluating and implementing targeted improvement measures. At the same time, product carbon footprint accounting is also an important means to promote green production and consumption.
The carbon footprint calculation results represent the total greenhouse gas emissions throughout the product life cycle, expressed in carbon dioxide equivalent (CO2-eq), with units of kg CO2-eq or g CO2-eq. Common greenhouse gases include carbon dioxide (CO2), methane (CH4), nitrous oxide (N2O), hydrofluorocarbons (HFCs), perfluorocarbons (PFCs), sulfur hexafluoride (SF6), and nitrogen trifluoride (NF3).
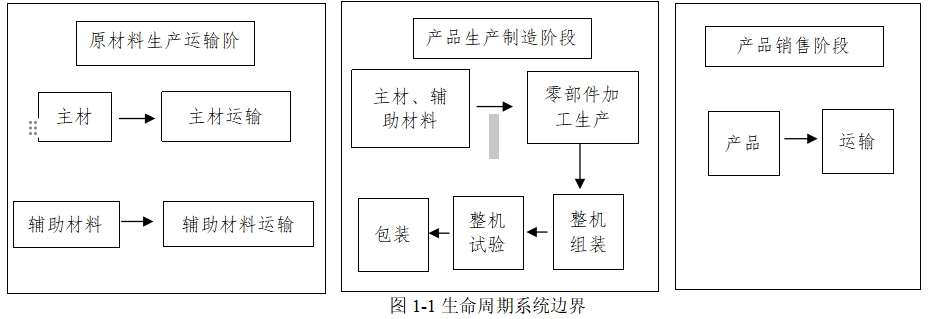
2.2.3 System Boundary
The product is an ML3PSF120 reducer. The product's life cycle system boundary is of the "cradle to gate" type. The accounting system boundary includes upstream raw materials and energy production and transportation stages, product manufacturing and packaging stages. The product life cycle system boundary is shown in Figure 1-1.
2.3 Data Selection Rules
Based on the selected system boundary and indicators, a set of data selection criteria should be established to ignore factors that have little impact on the evaluation results, thereby simplifying data collection and evaluation processes. The data selection criteria for this study are as follows:
1) In principle, energy consumption, raw and auxiliary materials, consumables during the use phase, etc., that have little impact on the carbon footprint results can be ignored. For example, ordinary consumption less than 1% of the product weight can be ignored, while material consumption containing precious metals (such as gold, silver, platinum, palladium, etc.) or high-purity substances (such as purity higher than 99.99%) can be ignored if less than 0.1% of the product weight. However, the total ignored material consumption is recommended not to exceed 5% of the product weight;
2) Consumption and emissions from infrastructure such as roads and factory buildings, production equipment, personnel within the plant, and living facilities can be ignored;
3) Low-value waste used as raw materials, such as fly ash, slag, straw, household waste, etc., can ignore their upstream production data.
2.4 Data Quality Requirements
The purpose of data quality assessment is to judge the credibility of the carbon footprint accounting results and conclusions, and to point out key factors for improving data quality. The data quality in this study can be controlled and evaluated from four aspects: representativeness, completeness, reliability, and consistency.
1) Data representativeness: including geographic representativeness, temporal representativeness, and technical representativeness.
Geographic representativeness: indicates the country or specific region represented by the data, which is closely related to the applicability of the research conclusions.
Temporal representativeness: priority should be given to selecting data from enterprises, literature, and background databases close to the study baseline year.
Technical representativeness: the actual representativeness of the production technology should be described.
2) Data completeness: including product model completeness and database completeness.
Model completeness: according to the definition of system boundaries and data selection criteria, the product life cycle model must include all major processes. The product life cycle model should reflect the actual production situation of the product as much as possible. For important raw and auxiliary materials (materials affecting the carbon footprint indicator by more than 5%), their production processes should be investigated as much as possible; if actual production process data cannot be obtained, background data can be used, but the source and basis for using background data must be explained in detail. Important raw and auxiliary materials that have not been investigated should be explained and described in the report.
Background database completeness: the background database generally contains hundreds of major energy sources, basic raw materials, and chemicals extraction, manufacturing, and transportation processes for at least one country or region to ensure the completeness of the background database itself.
3) Reliability: including reliability of real-world data, background data, and database.
Real-world data reliability: for major raw and auxiliary material consumption, energy consumption, and transportation data, actual production records from enterprises should be used as much as possible. All data will be recorded in detail from relevant data sources and data processing algorithms. Data obtained through empirical estimation or literature research should be explained and described in the report.
Background data reliability: upstream production process data of important materials and energy consumption should preferably select publicly available basic databases representing the country of origin and the same production technology, with priority given to recent data. If no background data meeting the requirements is available, data representing other countries or other technologies can be used as substitutes, and explanations should be provided in the report.
Database reliability: background databases should use statistical data, survey data, and literature from the country or region to reflect the energy structure, production system characteristics, and average production technology level of that country or region.
4) Consistency: all real-world data (including consumption and emission data for each process) should use consistent statistical standards, i.e., based on the same product output, the same process boundaries, and the same data statistical period. If inconsistencies exist, explanations should be provided in the report.
2.5 Software and Databases
This project combines the Chinese product life cycle greenhouse gas emission factor set CPCD, the Ecoinvent greenhouse gas emission database, the European life cycle assessment database ELCD, etc., to establish a product life cycle model and perform calculations and analysis. Some raw and auxiliary material data were obtained through literature review. The sources of carbon emission factors for each inventory item in the carbon footprint accounting are shown in Table 2-1, with specific values in Appendix 1.
Table 2-1 Carbon Emission Factor Source Table
| Inventory Name |
Associated Process |
Source of Carbon Emission Factor |
| Steel Energy Consumption Table |
Raw Material Production and Transportation Stage |
CO2 generated by fossil fuels during production process |
| Standard Parts Energy Consumption Table |
Raw Material Production and Transportation Stage |
CO2 generated by fossil fuels during production process |
| Raw Material Transportation Energy Consumption Table |
Raw Material Production and Transportation Stage |
CO2 generated by vehicle combustion of petroleum during transportation |
|
|
Product Manufacturing Stage |
CO2 generated by electricity consumption during product manufacturing process |
| Reducer Transportation Energy Consumption Table |
Product Sales Stage |
CO2 generated by vehicle combustion of petroleum during product delivery from company to customer |
3. Data Collection
The product production data collection period is from August 18, 2023, to October 18, 2023. During this period, the output of the reducer ML3PSF180 was 4 units. The following collected data are statistically based on the consumption and emissions of this batch production.
3.1 Raw Material Production and Transportation Process
Inputs in the raw material production and transportation stage include: steel used for various parts and standard parts of the ML4PSF120 reducer; outputs include: various parts and standard parts for the ML4PSF120 reducer; products are rough parts and finished standard parts. The detailed inventory summary is shown in Table 3-1.
Table 3-1 Steel Energy Consumption Table
Steel Energy Consumption Table (2670 kg CO2eq per ton of steel)
| Product Drawing Number |
Name and Specification |
Material |
Quantity |
Weight KG |
kgCO2 |
| ML3PSF120-00-01 |
Housing |
Q345A |
1 |
1900 |
5073 |
| ML3PSF120-00-02 |
Housing Cover |
Q345A |
1 |
1400 |
3738 |
| ML3PSF120-01 |
Input Gear Shaft |
18CrNiMo7-6 |
1 |
90 |
240.3 |
| ML3PSF120-02 |
Gear |
18CrNiMo7-6 |
1 |
150 |
400.5 |
| ML3PSF120-03 |
Gear Shaft |
18CrNiMo7-6 |
1 |
250 |
667.5 |
| ML3PSF120-04 |
Gear |
18CrNiMo7-6 |
1 |
380 |
1014.6 |
| ML3PSF120-05 |
Gear Shaft |
18CrNiMo7-6 |
1 |
280 |
747.6 |
| ML3PSF120-06 |
Gear |
18CrNiMo7-6 |
1 |
1160 |
3097.2 |
| ML3PSF120-07 |
Output Shaft |
18CrNiMo7-6 |
1 |
800 |
2136 |
| Total |
|
17114.7 |
|||
Table 3-2 Standard Parts Energy Consumption Table
Standard Parts Energy Consumption Table (per ton of standard parts = 2310kg CO2eq)
| Model |
Name and Specification |
Material |
Quantity |
Weight KG |
kgCO2 |
| ML3PSF120 |
Bearing |
Steel |
1 |
130 |
300.3 |
| ML3PSF120 |
Bolt |
CS |
|
4.5 |
10.395 |
| Total |
|
310.695 |
|||
Table 3-3 Steel Transportation Energy Consumption Table
Reference carbon emissions per ton of gasoline according to the Greenhouse Gas Emission Accounting Methods and Reporting Guidelines for Standard Machinery Equipment Manufacturing Enterprises: Emission per 1T gasoline = 0.798 tc (steel distance to company 200 km)
| Product Drawing Number |
Name and Specification |
Material |
Quantity |
Weight KG |
Gasoline consumption for transportation (L) |
kgCO2 |
| ML3PSF120-00-01 |
Housing |
Q345A |
1 |
1900 |
114 |
90.97 |
| ML3PSF120-00-02 |
Housing Cover |
Q345A |
1 |
1400 |
84 |
67.03 |
| ML3PSF120-01 |
Input Gear Shaft |
18CrNiMo7-6 |
1 |
90 |
5.4 |
4.31 |
| ML3PSF120-02 |
Gear |
18CrNiMo7-6 |
1 |
150 |
9 |
7.18 |
| ML3PSF120-03 |
Gear Shaft |
18CrNiMo7-6 |
1 |
250 |
15 |
11.97 |
| ML3PSF120-04 |
Gear |
18CrNiMo7-6 |
1 |
380 |
22.8 |
18.19 |
| ML3PSF120-05 |
Gear Shaft |
18CrNiMo7-6 |
1 |
280 |
16.8 |
13.41 |
| ML3PSF120-06 |
Gear |
18CrNiMo7-6 |
1 |
1160 |
69.6 |
55.54 |
| ML3PSF120-07 |
Output Shaft |
18CrNiMo7-6 |
1 |
800 |
48 |
38.30 |
| Total |
|
306.91 |
||||
Table 3-4 Standard Parts Transportation Energy Consumption Table
Reference carbon emissions per ton of gasoline according to the Greenhouse Gas Emission Accounting Methods and Reporting Guidelines for Standard Machinery Equipment Manufacturing Enterprises: Emission per 1T gasoline = 0.798 tc (standard parts distance to company 40 km)
| Model |
Name and Specification |
Material |
Quantity |
Weight KG |
Gasoline consumption for transportation (L) |
kgCO2 |
| ML3PSF120 |
Bearing |
Steel |
1 |
130 |
3.9 |
3.11 |
| ML3PSF120 |
Bolt |
CS |
|
4.5 |
0.135 |
0.11 |
| Total |
|
3.22 |
||||
3.2 CO2 Emissions During Reducer Production Process
In 2023, a total of 2586 reducers were produced, consuming 11,150,000 kWh of electricity. 11,150,000 kWh = 11,150 MWh. Based on the 2022 national grid average emission factor of 0.5703 t CO2/MWh, total emissions were 11,150 MWh * 0.5703 = 6358.845 t CO2. The average CO2 emission per unit reducer produced is 2458.9 kg.
3.3 CO2 Emissions During Reducer Transportation Process
Reference carbon emissions per ton of gasoline according to the Greenhouse Gas Emission Accounting Methods and Reporting Guidelines for Standard Machinery Equipment Manufacturing Enterprises: Emission per 1T gasoline = 0.798 tc (standard parts distance to company 450 km)
Table 3-5 Reducer Transportation Energy Consumption Table
| Model |
Quantity |
Weight KG |
Gasoline consumption for transportation (L) |
kgCO2 |
| ML3PSF120 |
1 |
6700 |
804 |
641.59 |
4 Product Carbon Footprint Results and Analysis
Based on the product raw and auxiliary materials list provided by the company, collected energy consumption data during production, and literature data for some raw materials, a lifecycle model of the ML3PSF120 reducer was established. The modeling results show that the lifecycle carbon emissions of the ML3PSF120 reducer are 4371.68 kg CO2-eq/t. The contribution of each inventory item to the carbon footprint is shown in Table 4-1. The carbon emissions from the transportation of each material are included in the carbon emission results of that material.
Table 4-1 Contribution Results of the Lifecycle Carbon Footprint of ML3PSF120 Reducer
| Inventory Name |
Carbon Emissions (kg CO2-eq) |
Contribution Percentage (%) |
Associated Process |
| Steel Energy Consumption Table |
941.31 |
21.5% |
Raw Material Production and Transportation Stage |
| Standard Parts Energy Consumption Table |
19.75 |
0.5% |
Raw Material Production and Transportation Stage |
| Steel Transportation Energy Consumption Table |
311.53 |
7.0% |
Raw Material Production and Transportation Stage |
| Standard Parts Transportation Energy Consumption Table |
3.27 |
0.1% |
Raw Material Production and Transportation Stage |
| Energy Consumption During Reducer Production Process |
2458.9 |
56.2% |
Product Manufacturing Stage |
| Reducer Transportation Energy Consumption Table |
651.24 |
14.7% |
Product Sales Stage |
5 Lifecycle Explanation
5.1 Assumptions and Limitations
The real-world data in this product LCA report for the ML3PSF120 reducer's production process mainly comes from company survey data. Background data is sourced from CPCD, Ecoinvent, ELCD, CLCD, and other databases, with some process data from literature. Due to project survey time and supply chain control limitations, actual production processes of important raw materials were not investigated, causing some deviation between calculated results and actual supply chain environmental performance. It is recommended to further investigate the production process data of major purchased raw materials when survey time and data availability allow, to improve data quality and support the company in promoting collaborative improvements in the supply chain.
5.2 Data Quality Assessment
5.2.1 Representativeness
The real-world data for each unit process in this report represents the general level of specific production enterprises. The real-world data uses company production statistics from August 18, 2023, to October 18, 2023.
5.2.2 Completeness
(1) Model Completeness
The product lifecycle model scope in this report includes upstream raw and auxiliary materials and energy production and transportation stages, product production and packaging stages, meeting the system boundary definition of this study. All raw material consumption during product production is considered.
(2) Background Database Completeness
The background databases used in this study include CPCD, Ecoinvent, ELCD, and CLCD databases. These databases cover major energy, basic raw materials, resource extraction, manufacturing, and transportation processes, meeting the requirements for background database completeness.
5.2.3 Reliability
(1) Real-World Data Reliability
In this report, all real-world process raw material and energy consumption data come from company statistical ledgers or measured data, ensuring high data reliability.
(2) Background Data Reliability
The database data used in this study are based on international standard statistical data, survey data, and literature, representing China's production technology and market average level. The original data and algorithms used in data collection are fully recorded, making the data collection process repeatable and traceable at any time.
5.2.4 Consistency
All real-world data in this study use consistent statistical standards, i.e., statistics are based on unit output of unit processes. All background data use consistent statistical standards, with related databases establishing unified core models during development and detailed documentation, ensuring a standardized and consistent data collection process.
6. Conclusions and Recommendations
6.1 Conclusions
Through the full lifecycle analysis of the product ML3PSF120, it is found that the lifecycle carbon footprint of ML3PSF120 is 4371.68 kg CO2-eq
Appendix 1 Explanation of Carbon Emission Factor Values for Each List Item
| Inventory Name |
Carbon Emissions Factor Value |
Factor Unit |
Factor Source |
Applicable Region |
Value Explanation |
| Steel Energy Consumption Table Standard Parts Energy Consumption Table |
2670 |
kg CO2 |
Large Steel |
Nationwide |
China Product Life Cycle Greenhouse Gas Other Emission Coefficient Set CPCD |
| CO2 Emissions During Reducer Production Process |
0.5703 |
t CO2/MWh |
Electricity |
Nationwide |
The average carbon emission factor of the national power grid in 2022 is 0.5703 t CO2/MWh |
Appendix 2 Explanation of Transportation Carbon Emission Factor Values
| Transportation Mode |
Transport Vehicle |
Carbon Emissions Factor Value |
Factor Unit |
Factor Source |
Applicable Region |
Value Explanation |
| Road Transport |
Automobile |
0.81 |
tc |
Gasoline |
Nationwide |
The carbon emission per ton of gasoline refers to the Standard for Greenhouse Gas Emission Accounting and Reporting Methods for Mechanical Equipment Manufacturing Enterprises |
Related News
Contact Us
Phone:+86-533-4661008
Fax: +86-533-4661009
Zip Code: 255200
E-mail:hczd@hczd.cn
Address: Boshan Economic Development Zone, Zibo City, Shandong Province